Recently I have been working on a task to enable CloudFront real-time logs and add them to CloudWatch. I have had already enabled Standard logs but found them useless as they are stored in S3 and therefore not easy searchable. It was desirable to be able to query logs in CloudWatch.
Real-time logs configuration
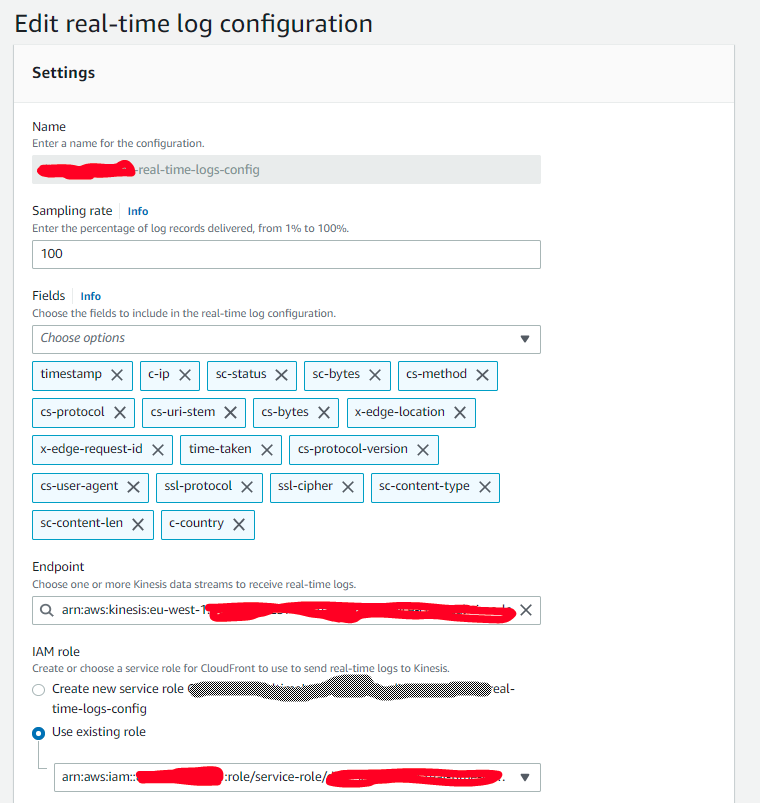
CloudFront real-time logs can be delivered only to Kinesis data streams. Unfortunately there is no out-of-the box integration with CloudWatch. I used sampling rate as 100 as I wanted to keep logs for all requests. Following fields seemed to me useful in any way for debugging and troubleshooting.
- timestamp
- c-ip
- sc-status
- sc-bytes
- cs-method
- cs-protocol
- cs-uri-stem
- cs-bytes
- x-edge-location
- x-edge-request-id
- time-taken
- cs-protocol-version
- cs-user-agent
- ssl-protocol
- ssl-cipher
- sc-content-type
- sc-content-len
- c-country
I did not include cs-headers field as it is truncated to 800 bytes and possibly may contain some restricted data.
MyCloudFrontRealTimeLogConfig:
  Type: AWS::CloudFront::RealtimeLogConfig
  Properties:
    EndPoints:
      - KinesisStreamConfig:
          RoleArn: !Ref MyRealTimeLogsCloudFrontRole
          StreamArn: !Ref MyRealTimeLogsKinesisDataStream
        StreamType: Kinesis
    Fields:
      - timestamp
      - c-ip
      - sc-status
      - sc-bytes
      - cs-method
      - cs-protocol
      - cs-uri-stem
      - cs-bytes
      - x-edge-location
      - x-edge-request-id
      - time-taken
      - cs-protocol-version
      - cs-user-agent
      - ssl-protocol
      - ssl-cipher
      - sc-content-type
      - sc-content-len
      - c-country
    Name: my-real-time-logs-config
    SamplingRate: 100
Lambda as log parser
I decided to create lambda which reads Kinesis records generated by CloudFront real-time log configuration. Lambda code just iterates through incoming records, prints raw content, parse it and prints again in a nicer way.
exports.handler = async (event, context) => {
  console.log('Processing', event.Records.length, 'kinesis record(s)');
  for (const record of event.Records) {
    const payload = Buffer.from(record.kinesis.data, 'base64').toString('ascii');
    console.log('Raw log from CloudFront:', payload);
    const fields = payload.trim().split('\t');

    if(fields.length == 18) {
      const formattedLog = {
        responseTimeEpoch: fields[0] * 1000,
        responseTime: new Date(fields[0] * 1000).toISOString(),
        sourceIp: fields[1],
        status: fields[2],
        responseAndHeadersLength: fields[3],
        httpMethod: fields[4],
        protocol: fields[5],
        path: decodeURI(fields[6]),
        requestAndHeadersLength: fields[7],
        xEdgeLocation: fields[8],
        cloudFrontRequestId: fields[9],
        requestDurationMillis: fields[10] * 1000,
        protocolVersion: fields[11],
        userAgent: decodeURI(fields[12]),
        sslProtocol: fields[13],
        sslCipher: fields[14],
        contentType: fields[15],
        responseLength: fields[16],
        sourceCountry: fields[17]
      }
      console.log('Formatted log from CloudFront:', formattedLog);
    } else {
      console.warn('CloudFront log contains unexpected number of fields:', fields.length);
    }
  }
  console.log('Successfully processed', event.Records.length, 'record(s)');
};
Sample lambda execution logs from CloudWatch
START RequestId: f08c1940-7e66-4d1a-ac48-337e40777344 Version: $LATEST
2022-09-08T14:19:35.097Z   f08c1940-7e66-4d1a-ac48-337e40777344  INFO     Processing 2 kinesis record(s)
2022-09-08T14:19:35.097Z   f08c1940-7e66-4d1a-ac48-337e40777344  INFO Raw log from CloudFront: 1662646719.474  198.235.24.154  200  1745 GET  https /my-api/f0d5bc60-21a2-4127-9580-ac546fc0f3c5    1622 LHR61-P2     8YCUy0i_FqNag6UPLKf7B72eGPPnO_nhUW8aNdsMpPgL_KEHA-lX1w==    0.343 HTTP/1.1           TLSv1.2    ECDHE-RSA-AES128-GCM-SHA256 application/json 1074 US

2022-09-08T14:19:35.098Z   f08c1940-7e66-4d1a-ac48-337e40777344  INFO Formatted log from CloudFront: {
  responseTimeEpoch: 1662646719474,
  responseTime: '2022-09-08T14:18:39.474Z',
  sourceIp: '198.235.24.154',
  status: '200',
  responseAndHeadersLength: '1745',
  httpMethod: 'GET',
  protocol: 'https',
  path: '/my-api/f0d5bc60-21a2-4127-9580-ac546fc0f3c5',
  requestAndHeadersLength: '1622',
  xEdgeLocation: 'LHR61-P2',
  cloudFrontRequestId: '8YCUy0i_FqNag6UPLKf7B72eGPPnO_nhUW8aNdsMpPgL_KEHA-lX1w==',
  requestDurationMillis: 343,
  protocolVersion: 'HTTP/1.1',
  userAgent: '',
  sslProtocol: 'TLSv1.2',
  sslCipher: 'ECDHE-RSA-AES128-GCM-SHA256',
  contentType: 'application/json',
  responseLength: '1074',
  sourceCountry: 'US'
}
2022-09-08T14:19:35.098Z   f08c1940-7e66-4d1a-ac48-337e40777344  INFO Raw log from CloudFront: 1662646719.776  198.235.24.154  200  1586 GET  https /my-api/a2c9171d-9681-41a9-9012-46cc4f8e8a39    1462 LHR61-P2     CDwpYJkyD1roCAnosG4Bu6K1GF0ZtR_kp9iTqyr3R4YGEGo2jj4EDg==    0.125 HTTP/1.1           TLSv1.2    ECDHE-RSA-AES128-GCM-SHA256 application/json 949  US

2022-09-08T14:19:35.098Z   f08c1940-7e66-4d1a-ac48-337e40777344  INFO Formatted log from CloudFront: {
  responseTimeEpoch: 1662646719776,
  responseTime: '2022-09-08T14:18:39.776Z',
  sourceIp: '198.235.24.154',
  status: '200',
  responseAndHeadersLength: '1586',
  httpMethod: 'GET',
  protocol: 'https',
  path: '/my-api/a2c9171d-9681-41a9-9012-46cc4f8e8a39',
  requestAndHeadersLength: '1462',
  xEdgeLocation: 'LHR61-P2',
  cloudFrontRequestId: 'CDwpYJkyD1roCAnosG4Bu6K1GF0ZtR_kp9iTqyr3R4YGEGo2jj4EDg==',
  requestDurationMillis: 125,
  protocolVersion: 'HTTP/1.1',
  userAgent: '',
  sslProtocol: 'TLSv1.2',
  sslCipher: 'ECDHE-RSA-AES128-GCM-SHA256',
  contentType: 'application/json',
  responseLength: '949',
  sourceCountry: 'US'
}

2022-09-08T14:19:35.098Z   f08c1940-7e66-4d1a-ac48-337e40777344  INFO     Successfully processed 2 record(s)
END RequestId: f08c1940-7e66-4d1a-ac48-337e40777344
REPORT RequestId: f08c1940-7e66-4d1a-ac48-337e40777344 Duration: 2.29 ms     Billed Duration: 3 ms Memory Size: 128 MB   Max Memory Used: 60 MB
Logs are printed in JSON human-readable format.
Other tips
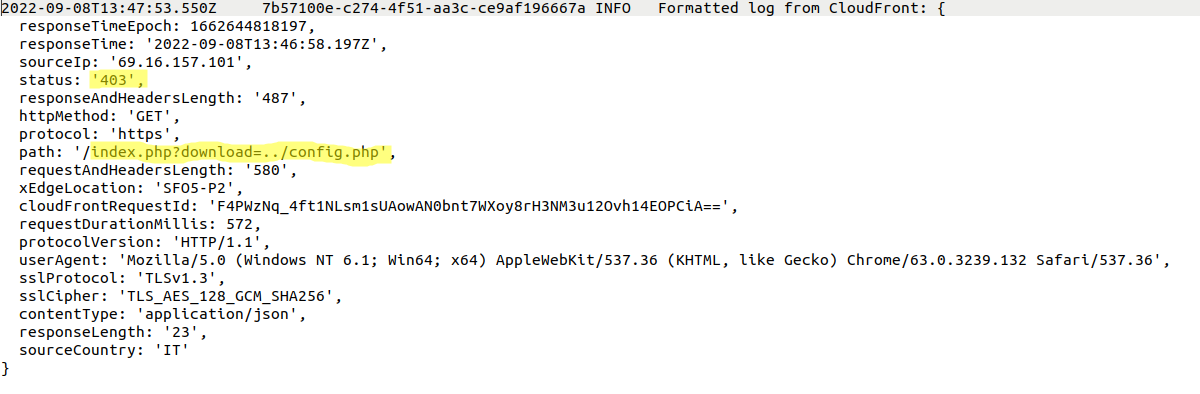
Malicious scripts
My api is exposed to public Internet. Malicous scripts are constantly trying to find any vulnerabilities e.g
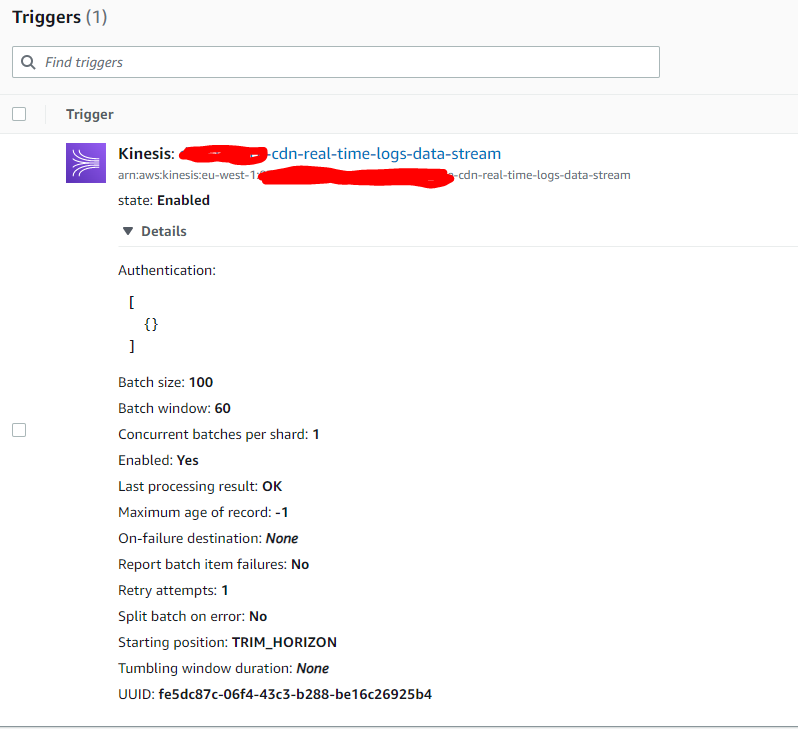
Kinesis trigger settings
I decided to process Kinesis records in 100 items batches gathered during 60 seconds. Real-time logs don’t have to be so real-time and it is fine to wait 60s between batches. It is to reduce lambda invocations. I decided to do only 1 retry attempt and in case of retry failure just drop Kinesis records. There is no problem if some logs are lost.
Lambda configuration
I decided to use smallest possible Memory settings 128 MB as well as Ephemeral storage 512MB.
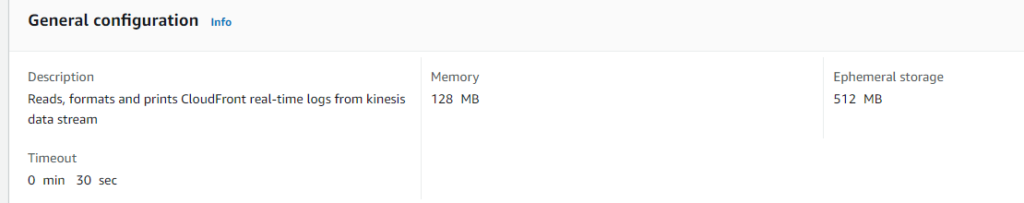
I found that lambda execution takes up to 200ms (in case of cold-start) and uses up to 70MB, e.g
REPORT RequestId: f965efb0-9286-47d9-82db-5c9d657d79e5       Duration: 16.35 ms          Billed Duration: 17 ms                Memory Size: 128 MB    Max Memory Used: 60 MB
REPORT RequestId: 0a027f2a-2587-4a93-a806-2742ca97a8cd       Duration: 17.86 ms          Billed Duration: 18 ms                Memory Size: 128 MB    Max Memory Used: 60 MB
REPORT RequestId: ca347bb5-bc86-4bf4-b4c9-b64fedfa8384       Duration: 20.31 ms          Billed Duration: 21 ms                Memory Size: 128 MB    Max Memory Used: 60 MB
REPORT RequestId: 2748fe8c-981f-4738-a55c-e0612b7b8309       Duration: 1.88 ms           Billed Duration: 2 ms                 Memory Size: 128 MB    Max Memory Used: 60 MB
REPORT RequestId: c92de783-e07b-4cf3-940e-e7d6c66722f7       Duration: 108.06 ms         Billed Duration: 109 ms               Memory Size: 128 MB    Max Memory Used: 57 MB           Init Duration: 190.28 ms
REPORT RequestId: 73d81d39-9146-4a76-a3da-039bc3434210       Duration: 15.67 ms          Billed Duration: 16 ms                Memory Size: 128 MB    Max Memory Used: 58 MB
REPORT RequestId: 4f502ac5-2d6d-4077-af22-0a12101e0259       Duration: 43.34 ms          Billed Duration: 44 ms                Memory Size: 128 MB    Max Memory Used: 57 MB           Init Duration: 147.25 ms
REPORT RequestId: 570b58c4-62f3-43c0-85c8-dd9388d375e9       Duration: 68.91 ms          Billed Duration: 69 ms                Memory Size: 128 MB    Max Memory Used: 57 MB           Init Duration: 150.42 ms
REPORT RequestId: 9193be75-b857-4cbb-9e0b-546dd300f7bd       Duration: 18.79 ms          Billed Duration: 19 ms                Memory Size: 128 MB    Max Memory Used: 58 MB
REPORT RequestId: b8f47771-a0d3-458a-ab47-b9e003c4846e       Duration: 25.05 ms          Billed Duration: 26 ms                Memory Size: 128 MB    Max Memory Used: 59 MB
REPORT RequestId: 249118c6-9be2-4f20-96ea-772e0f696111       Duration: 19.08 ms          Billed Duration: 20 ms                Memory Size: 128 MB    Max Memory Used: 59 MB
Kinesis capacity
I decided to use provisioned capacity with only 1 shard. I don’t want to page huge bill in case of scalling up Kinesis due to DDos attack. If I lose some records with logs due too Kinesis throttling that’s not a problem.
Why I needed CloudFront real-time logs?
Requests to my application go through CloudFront. They are forwarded to different origins, mostly ApiGateway but sometimes also to S3 or Cognito. I have good setup of ApiGateway logs and monitor 4xx and 5xx responses and check any potentionl bugs and problems. However, occasionally clients of my API complain that they are receiving 503 responses but I cannot find them in ApiGateway logs. It seems that such requests don’t reach my API at all but there is always slight possibility that CloudFront does not forward requests do ApiGateway but returns 503 instead. With CloudFront real-time logs I can check presense of any 503 responses and make sure that requests really reached my API.
Matching request logs on CloudFront, ApiGateway and Lambda
Majority of requests to my API generate single CloudFront log and single ApiGateway access log. Unfortunately there is no easy way to correlate these two logs. For ApiGateway access logs I log $context.requestId which is value of x-amzn-RequestId header but it is not available among CloudFront real-time logs fields. For CloudFront real-time logs I log x-edge-request-id which is value of X-Amz-Cf-Id header but it is not available among ApiGateway access logs. Therefore I decided to forward both values of these headers to lambda which is integrated with ApiGateway.
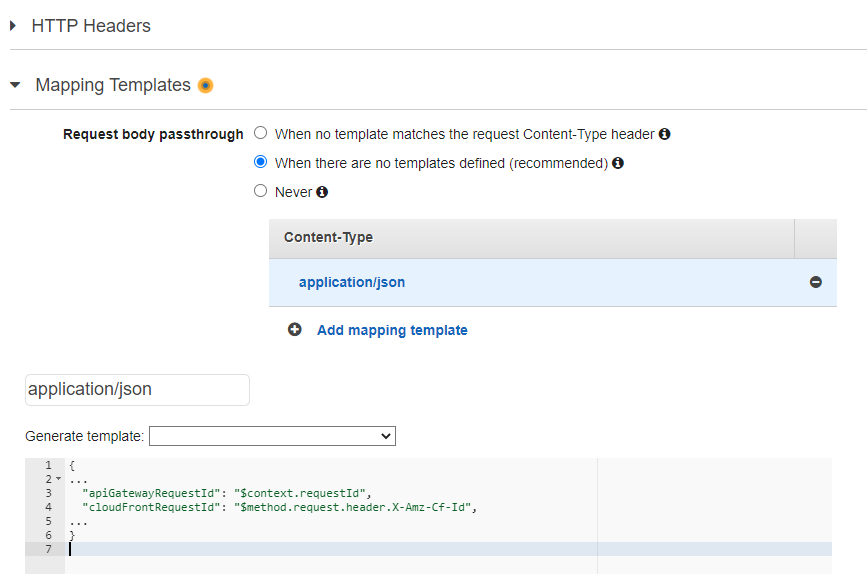
and log them in lambda code
2022-09-09 13:18:07.979; INFO MyLambda - cloudFrontRequestId: mOMitT7T_mIGlMMtcwsaBZtvInejj4dkAnp_YVTMixbYf0m-uIAgPw==, apiGatewayRequestId: 6cdf708a-787c-43e7-b15e-22da4c15a112